The CHART Method: How to Read Any Lab and Know Exactly What to Do
Jun 29, 2026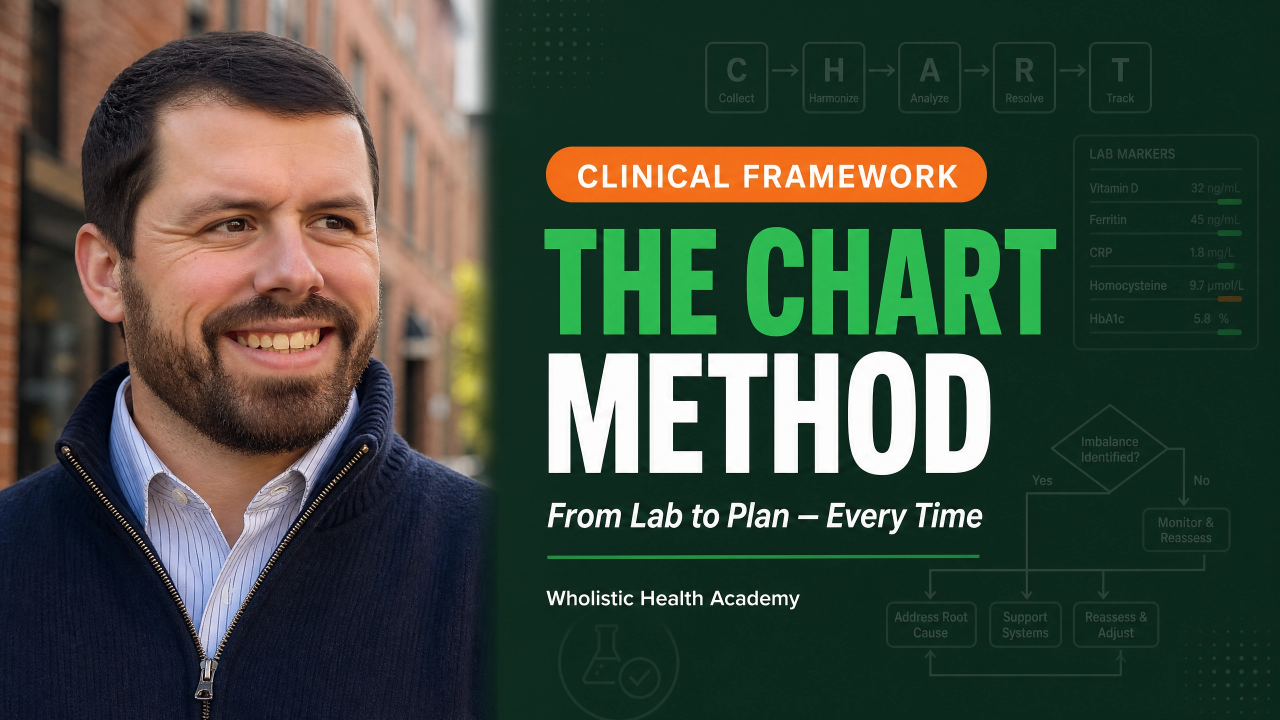
The CHART Method: How to Read Any Lab and Know Exactly What to Do
By Michael Rutherford
Most functional training teaches you what the markers mean. Almost none of it teaches you what to do next. That gap — between reading a lab and charting a plan from it — is exactly what the CHART Method closes. And the next cohort to learn it begins June 30th.
You Know the Feeling
A client hands you a lab panel. You know the optimal ranges. You can spot a few values that look off. And then you're staring at the page, wondering where to start, what matters most, and what you can actually do about it without stepping outside your scope.
That moment is the gap. Knowing what a marker means and knowing what to do are two completely different skills — and functional medicine training almost always teaches the first while quietly skipping the second. You end up with a head full of reference ranges and no system for turning them into a confident, scope-safe plan. The CHART Method was built to close that gap, one letter at a time.
C·H·A·R·T — The Five Steps
There's a reason for the name. Every lab panel is a chart — a page dense with numbers that can leave even a trained eye unsure where to look first. The CHART Method is how you chart your way through it: five steps that move you from raw data to a clear plan of action, every single time.
CComprehend the Physiology
Stop memorizing charts of highs and lows. You'll learn why each marker moves — the physiology behind it — so you can reason through any lab, even one you've never seen before. This is where you stop looking up what a marker "means" and start understanding what it's telling you.
HHarness Functional Ranges
Standard ranges flag disease. Functional ranges reveal dysfunction years earlier — the window where you can actually help.1 You'll learn to catch what conventional interpretation calls "normal" but isn't. This is where you start seeing what your clients' doctors missed.
AApply the Three-Tier Decision Tree
The signature framework at the heart of the method: a scope-safe reasoning system that tells you exactly where to start on any panel, what to prioritize, and how to stay within your scope every step of the way. You'll never stare at a lab again wondering "where do I even begin?"
RRecognize the Patterns
Individual markers tell you a little. Patterns tell you everything. You'll learn how markers move together across systems to reveal the root-cause story a single value never could.2 This is the skill that separates a practitioner who reads labs from one who truly understands them.
TTranslate Into Action
This is the step functional medicine training always skipped. You won't just understand the lab — you'll know exactly what to do about it, turning every interpretation into a clear, scope-safe plan you can stand behind. You walk away able to act, not just analyze.
Five steps. Any lab. From "what does this mean?" to "here's exactly what I'd do."
The summer cohort begins June 30th.
This is the last call to learn the CHART Method live. Enrollment closes when the cohort starts.
Two Frameworks Working Together
The CHART Method gives you the five-step process for reading any lab. The Three-Tier Decision Tree — built into the "A" step — gives you the scope-safe map of where to begin and what to prioritize, with blood sugar as the foundational anchor every panel builds from. Used together, they turn an overwhelming page of numbers into a clear, ordered, defensible reasoning process. That combination is what Mastery is built on, and it's what you don't get from a course that simply hands you a list of ranges to memorize.
See It Work: CHART on a Single Marker
Here's the method in miniature. Imagine a client's fasting insulin comes back at 11 µIU/mL, with a glucose of 84 and an HbA1c of 5.0. Watch how CHART moves you from a number on a page to a clear, scope-safe plan.
Comprehend the physiology. Insulin is the pancreas's response to glucose. When cells stop listening, the pancreas compensates by producing more of it — so a high-normal insulin is the sound of a system working harder than it should to keep glucose looking fine.
Harness functional ranges. Conventionally, an insulin of 11 is unremarkable. Functionally, optimal sits far lower — so this value isn't "normal," it's an early warning that conventional interpretation would wave through.
Apply the Three-Tier Decision Tree. Blood sugar is the foundational anchor of the whole panel, which places insulin at the very first tier — the place you start before anything else, because metabolic dysfunction ripples outward into thyroid, hormones, and inflammation.
Recognize the pattern. Insulin alone hints; the pattern confirms. Read alongside that pristine glucose and A1c, a high insulin reveals compensatory hyperinsulinemia — early insulin resistance that's been building for years while the glucose stayed beautiful. A single value would have missed it entirely.
Translate into action. Now you act — within scope. You educate the client on what's happening, support blood sugar stability through nutrition and lifestyle, and plan a re-test to track the trend. Not a diagnosis. Not a prescription. A clear, defensible plan you can stand behind.
That's one marker. Mastery teaches you to do it across an entire panel, fluently, on labs you've never seen before.
Is This You?
You became a health coach, an NTP, an FDN-P, or a nutrition professional because you wanted to help people get to the root of what's wrong — and increasingly, clients arrive holding lab panels and asking what they mean. You've learned the optimal ranges. You can tell something's off. But there's a quiet gap between seeing that a value isn't ideal and knowing, with confidence, what to do about it within your scope.
That gap is where second-guessing lives. It's why a panel can sit open on your screen while you wonder whether you're missing something, whether you're overstepping, whether you're starting in the right place. The CHART Method closes that gap — not with more ranges to memorize, but with a repeatable reasoning process that works the same way on every panel, including the ones that would have stumped you before. If that's the confidence you've been after, this cohort is built for you.
What's Inside Mastery
Mastering the Art of Functional Blood Chemistry isn't a video library you watch once and forget. It's a complete system for learning to reason through labs and act on them — with the support to make it stick, and the tools to grow your practice while you do.
›A complete framework system for root-cause lab interpretation — the CHART Method and the Three-Tier Decision Tree working together, so you always know where to start and what to do.
›Physiology on nearly a hundred markers — so you understand why every value moves, not just whether it's "high" or "low," and can reason through labs you've never seen.
›Hundreds of pages of quick-reference guides — for protocol creation and root-cause pattern mapping, so you're never working from a blank page.
›Live call support for Q&A and case studies — so you're never left working through a difficult panel alone.
›A social media content package for attracting new clients — ready-to-use content that helps you fill your practice with the people who need your help, while you sharpen the skills to serve them.
›An optional professional-grade transcript upgrade — for those who want the full curriculum in polished, searchable written form.
Enrollment Closes When the Cohort Begins
The Summer Cohort Starts June 30th
This is the final call to join this cohort of Mastering the Art of Functional Blood Chemistry. Learn the CHART Method, the Three-Tier Decision Tree, and the complete reasoning system — and walk away able to read any lab and know exactly what to do. Once the cohort begins, enrollment closes.
Enroll in MasteryFor health coaches, NTPs, FDN-Ps, and nutrition professionals.
Frequently Asked Questions
Do I need prior experience reading labs?
No. The CHART Method starts with the physiology — why each marker moves — and builds your reasoning from the ground up. You don't need to arrive already knowing how to interpret a panel; you need a system for learning to, and that's exactly what this is.
Will this keep me within my scope of practice?
Yes — scope-safety is built into the method, not bolted on. The Three-Tier Decision Tree is a scope-safe reasoning system, and the final step, Translate Into Action, is designed to produce plans you can stand behind as a coach or nutrition professional. The goal is confident reasoning within your scope, never diagnosis or prescription.
How is this different from other blood chemistry courses?
Most blood chemistry training hands you a list of optimal ranges and stops there. Mastery teaches the reasoning behind the numbers and — critically — the step almost every other program skips: knowing what to do about what you find. You leave able to act, not just analyze.
References
- Tabák, A. G., Jokela, M., Akbaraly, T. N., Brunner, E. J., Kivimäki, M., & Witte, D. R. (2009). Trajectories of glycaemia, insulin sensitivity, and insulin secretion before diagnosis of type 2 diabetes: An analysis from the Whitehall II study. The Lancet, 373(9682), 2215-2221. https://doi.org/10.1016/S0140-6736(09)60619-X
- Wilson, P. W. F., D'Agostino, R. B., Levy, D., Belanger, A. M., Silbershatz, H., & Kannel, W. B. (1998). Prediction of coronary heart disease using risk factor categories. Circulation, 97(18), 1837-1847. https://doi.org/10.1161/01.CIR.97.18.1837
