The Complete Guide to Functional Blood Chemistry
Dec 20, 2025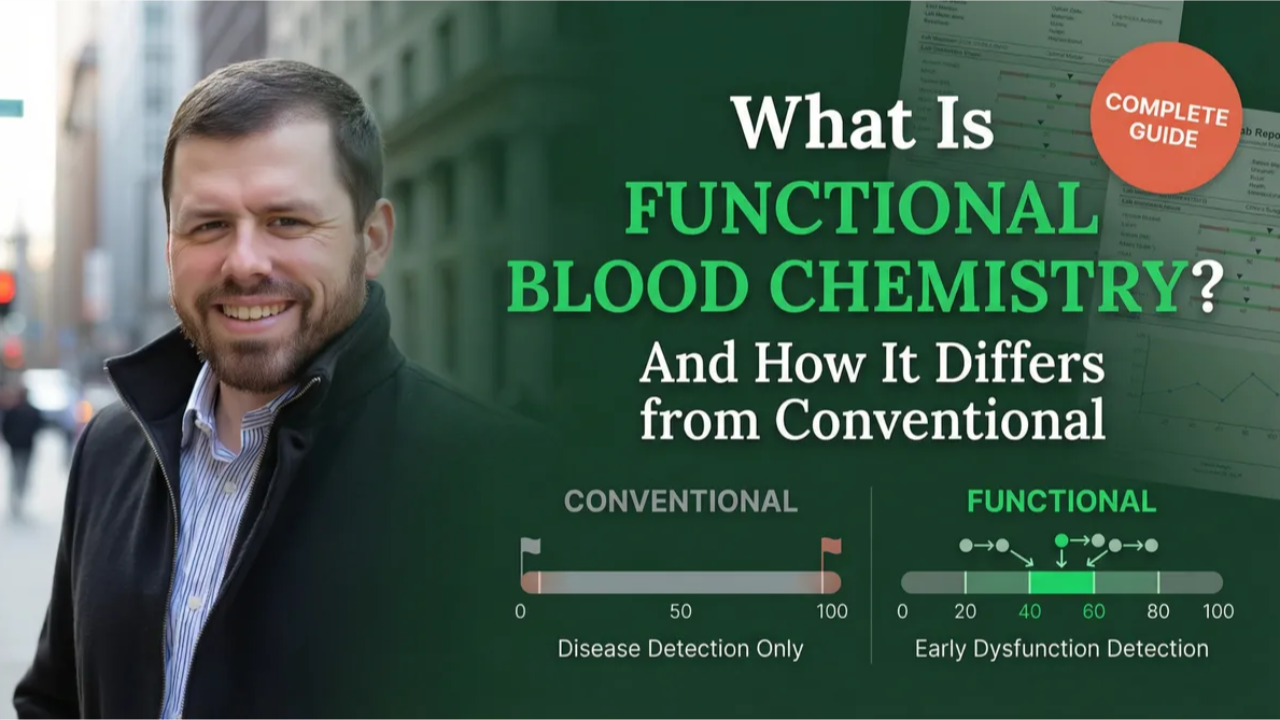
Functional blood chemistry interpretation uses research-supported optimal ranges to identify dysfunction before it becomes disease. Rather than relying on conventional reference ranges that only flag overt pathology, this clinical framework detects the early-stage patterns that drive the symptoms your clients are already experiencing—often years before a conventional diagnosis would be made.
This guide covers the core principles, clinical reasoning methodology, and system-by-system framework that practitioners need to interpret blood work with confidence. Whether you are a health coach, nutritional therapy practitioner, FDN-P, or nutritionist, this is the foundational reference for understanding how functional blood chemistry works and why it changes outcomes for your clients.
Why Do Functional Ranges Matter?
Conventional reference ranges are statistical constructs derived from the general population—a population where only 12% of adults are considered metabolically healthy and approximately 92% demonstrate at least one nutrient deficiency. These ranges identify the boundaries of overt pathology, not the window of optimal function. A value that falls “within normal limits” may still represent significant suboptimal performance.
The research supports this distinction across virtually every system. Fasting glucose values above 85 mg/dL independently predict cardiovascular death in otherwise healthy individuals—well below the conventional “concern” threshold of 100 mg/dL.1 Progressive diabetes risk increases with each milligram per deciliter of fasting glucose across the entire normal range.2 TSH values above 2.5 mIU/L are associated with increased progression to overt hypothyroidism, despite the conventional range extending to 4.5.3,4 And elevated HbA1c within nondiabetic ranges is associated with increased cardiovascular disease and mortality.5
These are not marginal differences. The gap between the conventional low end and the functional optimal represents years of potential early intervention—the space where lifestyle, dietary, and targeted nutritional strategies are most effective. (For a detailed comparison of how these two range systems work in practice, see our guide on LDL cholesterol and why the number alone isn’t enough.)
What Is the Three-Tier Decision Tree?
Effective blood chemistry interpretation requires more than knowing optimal ranges. It requires a prioritization framework—a method for determining where to focus when multiple systems show dysfunction simultaneously, which is the rule rather than the exception.
The Three-Tier Decision Tree uses blood sugar stability as the foundational anchor because metabolic dysregulation drives dysfunction in virtually every other system. If your client’s blood sugar is unstable, their inflammation will persist, their hormones will remain disrupted, and their nutrient status will continue to decline regardless of what else you do.
The Three Tiers
Tier 1 — Blood Sugar / Metabolic Foundation: Fasting glucose, fasting insulin, HbA1c, HOMA-IR, triglycerides, and HDL form the metabolic core. Dysglycemia drives systemic inflammation, hormonal imbalance, nutrient depletion, liver dysfunction, cardiovascular risk, and thyroid dysfunction. This is addressed first—typically over the initial 4–6 weeks.
Tier 2 — Nutrients & Stress / Co-Factors: Iron panel, B vitamins, vitamin D, minerals, thyroid panel, cortisol, DHEA-S, and sex hormones. Nutrient deficiencies and stress response dysregulation undermine all other interventions. Addressed concurrently with or after Tier 1 stabilization.
Tier 3 — Inflammation & Immune / Downstream Effects: hs-CRP, ESR, ferritin (as an acute-phase reactant), WBC, and the neutrophil-to-lymphocyte ratio (NLR). These are often symptoms of Tier 1 and Tier 2 imbalances rather than the root cause. If these markers remain elevated after addressing the first two tiers, suspect a hidden root cause such as infection, toxin exposure, or autoimmunity.
This hierarchy is not arbitrary. Insulin resistance impairs deiodinase enzyme activity, reducing T4-to-T3 thyroid conversion while simultaneously increasing reverse T3 production. It shifts lipoprotein patterns toward small dense LDL particles that are more atherogenic.6 It depletes magnesium, disrupts cortisol rhythms, and elevates inflammatory markers. Addressing Tier 1 resolves or improves dysfunction in downstream systems without the practitioner ever directly targeting those systems. (For the full clinical application of this framework to insulin resistance patterns, see The Complete Practitioner Guide to Insulin Resistance.)
How Does the 8-Step Clinical Reasoning Process Work?
Pattern recognition is the skill that separates a practitioner who reads lab reports from one who interprets them. But pattern recognition without a systematic process leads to bias, missed connections, and inconsistent results. The 8-Step Clinical Reasoning Process provides the structure that makes interpretation reliable and reproducible. (We cover the theoretical foundation in Pattern Recognition in Blood Chemistry: A Clinical Framework.)
Step 1: Safety Scan — Identify red flags requiring immediate medical referral. This always comes first. ALT/AST above 200, bilirubin above 3 mg/dL, eGFR below 30, severe electrolyte abnormalities, or any triple-low pattern (WBC, RBC, and platelets all critically low) require immediate referral.
Step 2: Pattern Recognition — Look for clusters of abnormal markers that tell a coherent physiological story. A single elevated marker is data. A cluster of related markers pointing in the same direction is a pattern.
Step 3: Hypothesis Generation — Form working theories about root causes based on identified patterns.
Step 4: Hypothesis Testing — Use additional markers to confirm or refute working theories.
Step 5: Interference Assessment — Identify factors that may be blocking progress—medications, chronic stress, nervous system dysregulation, or ongoing exposures. (For a deeper exploration of how medications affect this step, see The Hidden Variable: How Medications Distort Lab Interpretation.)
Step 6: Tier Assessment — Determine which tier has the most abnormal markers and highest severity to focus initial intervention.
Step 7: Severity Assessment — Quantify how far outside optimal each marker falls. This informs urgency and intervention intensity.
Step 8: Protocol Development — Build a prioritized, scope-safe intervention plan. Budget-conscious (typically $100–150/month in supplements), limited to 7–9 products maximum, and focused on compliance over comprehensiveness.
What Does Each Major System Tell You?
A comprehensive blood chemistry panel spans multiple physiological systems. Here is how each contributes to the clinical picture.
Blood Sugar & Metabolic Markers — Fasting glucose (optimal: 82–88 mg/dL), fasting insulin (optimal: 3–6 μIU/mL), HbA1c (optimal: 4.8–5.4%), and HOMA-IR (optimal: 0.5–1.9) form the metabolic foundation. The TG/HDL ratio (optimal: <2.0) is the best surrogate marker for insulin resistance on a standard lipid panel.7 By the time fasting glucose is elevated above 100, insulin resistance has likely been developing for a decade or more. Fasting insulin and HOMA-IR detect this process years earlier, making them essential additions to any comprehensive panel.8
Thyroid Function — TSH (optimal: 1.0–2.5 mIU/L), Free T4 (optimal: 1.1–1.6 ng/dL), Free T3 (optimal: 3.0–4.0 pg/mL), and Reverse T3 (optimal: 10–17 ng/dL) provide the full conversion picture. TSH is the last marker to change—relying on it alone misses subclinical dysfunction entirely. Free T3 correlates best with symptoms. Reverse T3 is the key differentiator between inflammatory conversion dysfunction and nutrient-deficiency-driven low T3 patterns. Both TPO and thyroglobulin antibodies should be tested, since 10–20% of Hashimoto’s cases present with only thyroglobulin antibodies.9 (For the full thyroid assessment methodology, see The Reverse T3 Myth.)
Cardiovascular & Lipid Markers — Total cholesterol, LDL-C, HDL-C, and triglycerides form the standard panel, but they tell an incomplete story. LDL particle number (measured via ApoB or NMR) is a significantly better predictor of cardiovascular risk than LDL cholesterol alone.10 Roughly 20–30% of individuals show discordant patterns where LDL-C and particle number do not align—meaning standard testing either misses hidden risk or incorrectly classifies people as high-risk. (See LDL Cholesterol: Why the Number Alone Isn’t Enough for the full assessment framework.)
Iron Panel — Ferritin (optimal: 30–125 ng/mL), serum iron, TIBC, and iron saturation must be evaluated together—never ferritin in isolation. Ferritin is both an iron storage protein and an acute-phase reactant, meaning it rises with inflammation regardless of actual iron status.11 A ferritin of 90 ng/mL could represent adequate iron stores or masked iron deficiency with concurrent inflammation. Only the full panel differentiates these scenarios.
Liver & Detoxification — ALT (most liver-specific), AST (mitochondrial damage marker), GGT (oxidative stress and detox capacity), ALP (bile flow), and bilirubin (Phase II detox capacity) create the hepatic picture. GGT deserves special attention: it is an early predictive marker for atherosclerosis, heart failure, gestational diabetes, and multiple liver conditions, all linked to its role in oxidative stress.12 Low bilirubin (<0.5 mg/dL) often indicates poor Phase II detoxification capacity rather than optimal liver function.
Inflammation Markers — The five essential markers are hs-CRP (optimal: <1.0 mg/L), ESR, ferritin (in context), WBC, and the neutrophil-to-lymphocyte ratio (NLR; optimal: 1.3–2.0). A meta-analysis of 54 studies confirmed that hs-CRP independently predicts coronary heart disease, stroke, and mortality beyond conventional risk factors.13 NLR adds a dimension that hs-CRP alone cannot capture—it reflects the balance between innate immune activation and adaptive immune capacity, making it a sensitive indicator of chronic stress, metabolic dysfunction, and systemic inflammation.14
How Does Scope of Practice Apply?
Functional blood chemistry interpretation is built on an educational framework, not a diagnostic one. Practitioners working within scope educate clients about functional patterns and optimal ranges, guide lifestyle, dietary, and supplement recommendations, and refer when complexity exceeds their training or when safety red flags emerge. The language matters: “these markers suggest we should look at…” is scope-safe; “you have…” is not. (For the full legal and ethical framework, see Scope of Practice: Clinical Reasoning Within Legal Boundaries.)
Knowing when to refer is as essential as knowing how to interpret. Build relationships with one or two trusted physicians or naturopathic doctors. Maintain clear referral criteria for safety red flags, non-response after 8–12 weeks of well-designed protocols, and situations where prescriptive intervention may be necessary. The best practitioners understand that scope of practice is a professional boundary that builds trust and credibility, not a limitation.
How Do You Put This Into Practice?
Mastering functional blood chemistry requires structured training, a reliable clinical framework, and consistent practice. Volume builds pattern recognition—the more panels you interpret, the faster you identify the recurring patterns that drive most client presentations.
Mastering the Art of Functional Blood Chemistry at Wholistic Health Academy is designed to take practitioners from foundational concepts through advanced clinical reasoning. The course covers comprehensive panel interpretation (CBC, CMP, lipid, iron, thyroid, inflammatory markers, and more), the Three-Tier Decision Tree methodology, the 8-Step Clinical Reasoning Process, and scope-safe clinical language—all with real case application.
New to blood chemistry? Blood Chemistry 101 builds the foundational marker knowledge—what each marker measures, why it matters, and how to start recognizing basic patterns—before advancing to the full clinical reasoning framework in MTAOFBC. It is the ideal starting point for practitioners who want to build confidence with lab work before committing to the comprehensive course.
And once you have the clinical reasoning framework, tools like Blood Chem Studio help you apply it efficiently—automatically applying functional ranges, calculating ratios like HOMA-IR and TG/HDL, and generating structured client-ready reports in minutes. (For a look at what to evaluate in blood chemistry software, see What to Look for in Blood Chemistry Software.)
Ready to Master Functional Blood Chemistry?
From foundational ranges to advanced pattern recognition—get the complete clinical reasoning framework in one comprehensive course.
Explore Mastering the Art of Functional Blood ChemistryFrequently Asked Questions
What is the difference between functional and conventional blood chemistry?
Conventional blood chemistry uses wide reference ranges designed to detect overt disease. Functional blood chemistry uses narrower, research-supported optimal ranges to identify early-stage dysfunction and guide preventive intervention. For example, the conventional TSH range extends to 4.5 mIU/L, while research supports a functional optimal of 1.0–2.5 mIU/L based on studies of rigorously screened healthy individuals.3
What blood panels are needed for a comprehensive functional assessment?
A comprehensive baseline includes a CBC, CMP, full lipid panel (with calculated TG/HDL ratio), iron panel with ferritin, complete thyroid panel (TSH, Free T4, Free T3, Reverse T3, TPO and thyroglobulin antibodies), fasting insulin, HbA1c, hs-CRP, GGT, vitamin D, and homocysteine. Advanced panels may add LDL particle number (ApoB or NMR), omega-3 index, cortisol, DHEA-S, and sex hormones depending on clinical presentation.
Why is blood sugar addressed before thyroid or hormones?
Blood sugar dysregulation drives dysfunction across all other systems. Insulin resistance impairs thyroid hormone conversion, shifts lipid patterns toward atherogenic profiles, depletes key nutrients, and elevates inflammatory markers. Without metabolic stability, thyroid protocols, hormone support, and anti-inflammatory strategies demonstrate very limited success regardless of their sophistication.
Can health coaches and nutritionists use functional blood chemistry?
Yes. Health coaches, NTPs, FDN-Ps, and nutritionists can interpret blood work for educational purposes within their scope of practice. The critical requirement is using scope-safe language (educating about patterns, not diagnosing conditions), maintaining clear referral criteria, and having structured clinical reasoning training. See our full guide on scope of practice for blood chemistry.
How often should clients retest their blood work?
Ideally every six months, but at minimum annually. The initial retest after beginning a protocol is typically at 6–12 weeks to assess response. A good response shows 50% improvement in elevated markers moving toward optimal. Poor response (less than 25% improvement after 8–12 weeks) warrants investigation of blocking factors or referral for additional evaluation.
What is HOMA-IR and how do you calculate it?
HOMA-IR (Homeostatic Model Assessment of Insulin Resistance) is a calculated index that estimates insulin resistance using two fasting lab values: fasting glucose and fasting insulin. The formula is (fasting glucose × fasting insulin) ÷ 405, using mg/dL for glucose and μIU/mL for insulin. The conventional cutoff for insulin resistance is typically >2.5, while the functional optimal range is 0.5–1.9. HOMA-IR detects insulin resistance years before fasting glucose becomes abnormal on its own, making it one of the most valuable calculated markers in functional blood chemistry. Tools like Blood Chem Studio calculate HOMA-IR automatically from inputted lab values.
References
- Bjørnholt, J. V., Erikssen, G., Aaser, E., et al. (1999). Fasting blood glucose: an underestimated risk factor for cardiovascular death. Diabetes Care, 22(1), 45–49.
- Nichols, G. A., Hillier, T. A., & Brown, J. B. (2008). Normal fasting plasma glucose and risk of type 2 diabetes diagnosis. The American Journal of Medicine, 121(6), 519–524.
- Wartofsky, L., & Dickey, R. A. (2005). The evidence for a narrower thyrotropin reference range is compelling. Journal of Clinical Endocrinology & Metabolism, 90(9), 5483–5488.
- Hamilton, T. E., Davis, S., Onstad, L., & Kopecky, K. J. (2008). Thyrotropin levels in a population with no clinical, autoantibody, or ultrasonographic evidence of thyroid disease. Journal of Clinical Endocrinology & Metabolism, 93(4), 1224–1230.
- Selvin, E., Steffes, M. W., Zhu, H., et al. (2010). Glycated hemoglobin, diabetes, and cardiovascular risk in nondiabetic adults. The New England Journal of Medicine, 362(9), 800–811.
- Garvey, W. T., Kwon, S., Zheng, D., et al. (2003). Effects of insulin resistance and type 2 diabetes on lipoprotein subclass particle size and concentration. Diabetes, 52(2), 453–462.
- Kosmas, C. E., Rodriguez Polanco, S., Bousvarou, M. D., et al. (2023). The Triglyceride/High-Density Lipoprotein Cholesterol (TG/HDL-C) Ratio as a Risk Marker for Metabolic Syndrome and Cardiovascular Disease. Diagnostics, 13(5), 929.
- DiNicolantonio, J. J., Bhutani, J., & O’Keefe, J. H. (2017). Postprandial insulin assay as the earliest biomarker for diagnosing pre-diabetes, type 2 diabetes and increased cardiovascular risk. Open Heart, 4(2), e000656.
- Toulis, K. A., Anastasilakis, A. D., Tzellos, T. G., Goulis, D. G., & Kouvelas, D. (2010). Selenium supplementation in the treatment of Hashimoto’s thyroiditis: A systematic review and a meta-analysis. Thyroid, 20(10), 1163–1173.
- De Oliveira-Gomes, D., Tsimikas, S., Ference, B. A., et al. (2024). Apolipoprotein B: Bridging the Gap Between Evidence and Clinical Practice. Circulation, 150(17), 1353–1366.
- Knovich, M. A., Storey, J. A., Coffman, L. G., Torti, S. V., & Torti, F. M. (2009). Ferritin for the clinician. Blood Reviews, 23(3), 95–104.
- Koenig, G., & Seneff, S. (2015). Gamma-Glutamyltransferase: A Predictive Biomarker of Cellular Antioxidant Inadequacy and Disease Risk. Disease Markers, 2015, 818570.
- Emerging Risk Factors Collaboration. (2010). C-reactive protein concentration and risk of coronary heart disease, stroke, and mortality: an individual participant meta-analysis. Lancet, 375(9709), 132–140.
- Fest, J., Ruiter, R., Ikram, M. A., et al. (2018). Reference values for white blood-cell-based inflammatory markers in the Rotterdam Study. Scientific Reports, 8(1), 10206.
Michael Rutherford • Wholistic Health Academy • wholistichealthacademy.org
