Why Total Cholesterol Fails as a Risk Assessment Tool | WHA
Mar 04, 2026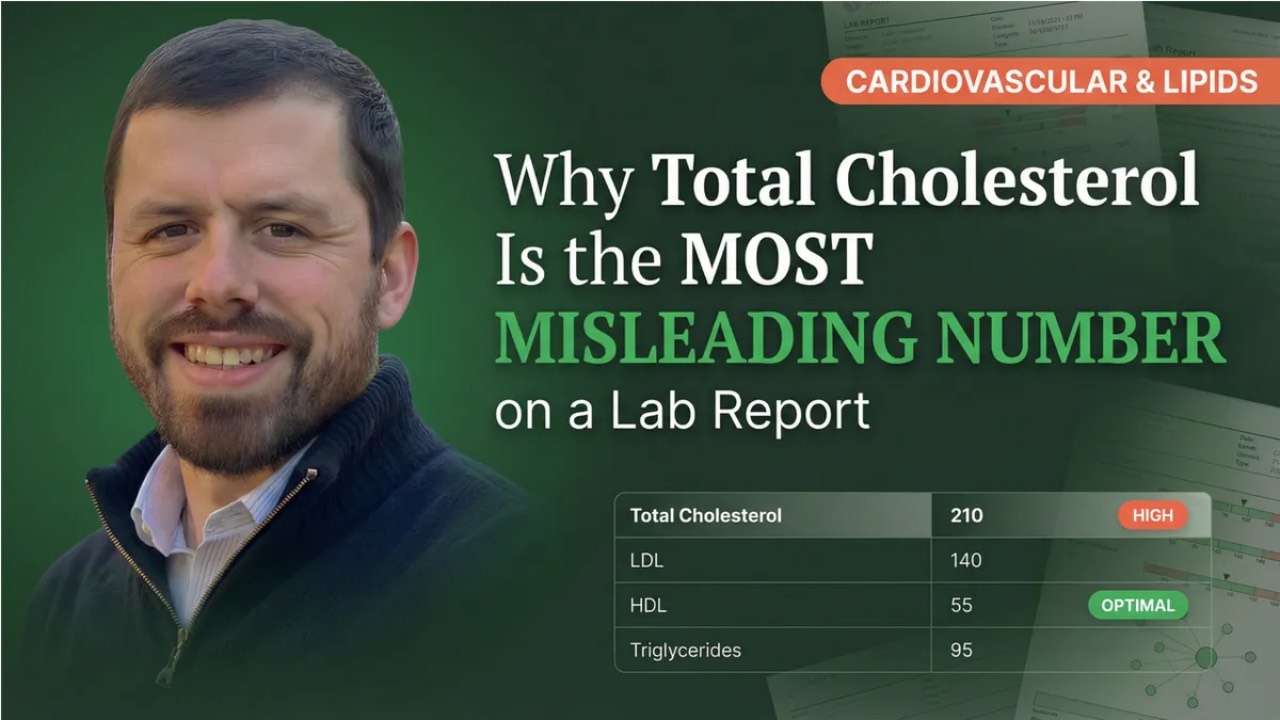
Cardiovascular & Lipids
Why Total Cholesterol Fails as a Risk Assessment Tool
The Case for Advanced Lipid Testing & Pattern Recognition
Total cholesterol is the most widely reported lipid value in conventional medicine — and one of the least clinically useful. It collapses three fundamentally different variables into a single sum that erases the detail that actually determines cardiovascular risk: particle count, particle size, metabolic context, and inflammatory status.
This guide examines why total cholesterol fails as a risk tool, what the mortality data actually shows about cholesterol thresholds, how discordance between standard and advanced markers creates hidden risk, and what practitioners should be assessing instead. If you’ve been using total cholesterol to guide clinical decisions, the evidence will change your approach.
The Football Score Problem
Total cholesterol is calculated as LDL-C + HDL-C + (Triglycerides ÷ 5). That formula combines protective cholesterol, potentially atherogenic cholesterol, and a fraction of triglycerides into one number. The problem with any composite number is that it collapses multiple distinct variables into a single value, erasing the clinical detail that matters.
Imagine someone tells you the total combined score of last night’s football game was 45 points. What do you actually know? Was it 38–7 — a blowout? Or 24–21 — a nail-biter? Was one team dominant or did it go back and forth? You have no idea. The sum erases the story. Total cholesterol works exactly the same way.
A total cholesterol of 240 mg/dL could mean HDL of 85, LDL of 120, and triglycerides of 75 — a metabolically healthy profile with excellent ratios. Or it could mean HDL of 38, LDL of 160, and triglycerides of 210 — a pattern driven by insulin resistance with significant cardiovascular risk. Same total. Radically different clinical pictures.
This is why pattern recognition in blood chemistry is essential. A single number stripped of context leads to clinical errors in both directions — treating people who don’t need intervention and missing those who do.
What the Mortality Data Actually Shows
The conventional threshold flags total cholesterol above 200 mg/dL as elevated. But the research paints a more complicated picture — one that challenges the “lower is always better” assumption from both directions.
A major conference report in Circulation examined low blood cholesterol across multiple large cohort studies. The findings were striking: very low cholesterol levels — below 160 mg/dL — are associated with increased mortality from non-cardiovascular causes including cancer, respiratory disease, and liver disease.1 The conventional push toward lower cholesterol may carry its own risks, particularly when total cholesterol is used as the primary metric.
A systematic review in BMJ Open found that in adults over 60, LDL cholesterol showed no association with cardiovascular mortality and was inversely associated with all-cause mortality in most people over 60.2 Yet conventional medicine applies the same “under 200” target regardless of age — potentially driving interventions in populations where higher cholesterol levels may actually be protective.
Extremely high HDL isn’t benign either. Two large prospective cohort studies found that HDL above 116 mg/dL in men and 135 mg/dL in women was paradoxically associated with increased all-cause mortality — demonstrating a U-shaped curve that the conventional “higher HDL is always better” advice completely misses.3
Clinical Pearl
The evolution of cholesterol testing reveals how limited total cholesterol always was. In the 1950s–1970s, total cholesterol was the only available measurement — and the upper limit was 300 mg/dL. By the 1980s, HDL and LDL were differentiated. By the 2000s, advanced particle testing emerged. Each advancement made total cholesterol less relevant as a standalone metric. We’re still using a 1970s-era number to make clinical decisions.
Functional Optimal Ranges: Age-Adjusted
The Discordance Problem: Where Total Cholesterol Fails Most
The most dangerous limitation of total cholesterol is its potential to be completely discordant with advanced markers that actually predict events. Approximately 20–30% of people have patterns where LDL-C and LDL particle number don’t align. Since LDL-C is the largest component of total cholesterol, this discordance propagates directly into the composite value. When LDL-C lies, total cholesterol lies with it.
The Framingham Offspring Study demonstrated that LDL particle number was a significantly stronger predictor of cardiovascular disease than LDL-C concentration, particularly in women.4 The EPIC-Norfolk Prospective Population Study confirmed this in a large cohort of apparently healthy individuals — LDL-P predicted coronary artery disease risk beyond both the Framingham Risk Score and LDL-C.5
A 2024 review in Circulation confirmed that apolipoprotein B outperforms LDL-C for predicting atherosclerotic cardiovascular disease.6 A systematic review in Pharmacological Research reached the same conclusion across multiple study designs.7 The clinical implication is clear: the cholesterol content of lipoproteins (what total cholesterol partially measures) matters far less than the number of atherogenic particles in circulation.
The Discordance Patterns
High LDL-C with Low LDL-P — Fewer, larger particles carrying more cholesterol each. This pattern often produces the best cardiovascular outcomes. Total cholesterol appears elevated, but actual risk is low.
Normal LDL-C with High LDL-P — Many small, dense particles each carrying less cholesterol. Total cholesterol looks reassuring, but atherogenic particle burden is elevated. Small dense LDL increases cardiovascular risk approximately threefold.
Total cholesterol captures neither of these distinctions. For the complete framework on particle assessment, see LDL Cholesterol: Why the Number Alone Isn’t Enough.
The Hidden Driver Total Cholesterol Can’t See
One of the most important clinical insights in lipid assessment: insulin resistance fundamentally reshapes the lipid profile in ways total cholesterol cannot capture.
When insulin resistance is present, the liver overproduces triglyceride-rich VLDL particles. This drives a cascade: increased triglycerides, decreased HDL, a shift toward small dense LDL particles, and elevated ApoB — all while total cholesterol and even LDL-C may remain within conventional limits.
Research has demonstrated that insulin resistance and type 2 diabetes are independently associated with increased small LDL particle concentration and decreased particle size — even after controlling for triglyceride levels.8 Studies using LDL particle size have identified at-risk individuals who would have been completely missed by LDL-C, non-HDL-C, or triglycerides alone.9 This is precisely the population total cholesterol misses entirely.
Three-Tier Decision Tree Application
Before targeting cholesterol directly, assess the metabolic foundation:
Tier 1: Is there insulin resistance driving the lipid pattern? (Fasting insulin, HOMA-IR, TG/HDL ratio)
Tier 2: Is thyroid dysfunction impairing cholesterol clearance? (TSH, Free T4, Free T3 — the liver has T3 receptors)
Tier 3: Is inflammation creating oxidized LDL? (hs-CRP, iron status, homocysteine)
Address the tier that’s driving the pattern. The lipid profile is the symptom, not the root cause.
This is why the clinical reasoning framework places metabolic health assessment at the foundational tier. If insulin resistance is present, addressing it becomes the priority for lipid management and cardiovascular risk reduction. Total cholesterol provides no insight into this metabolic driver.
What Should Practitioners Assess Instead?
Advanced lipid testing shifts the focus from cholesterol content to particle characteristics and metabolic context. Multiple reviews have confirmed that this approach provides substantially better cardiovascular risk assessment than standard lipid panels.10
Advanced Markers That Actually Predict Risk
→ LDL Particle Number (LDL-P) via NMR spectroscopy — direct vehicle count
→ Apolipoprotein B (ApoB) — one molecule per atherogenic particle; the single best marker for atherogenic burden
→ Small Dense LDL Concentration — the most atherogenic particle subclass; 3x risk multiplier
→ TG/HDL Ratio — the best insulin resistance proxy available on a standard panel
→ Oxidized LDL — inflammatory and oxidative burden assessment
→ Lipoprotein(a) — 90% genetically determined; independent risk factor standard panels miss entirely
Total cholesterol still has a role as an initial screening value and an internal consistency check — if the individual components don’t add up to the reported total, that warrants investigation. Extremely low total cholesterol (below 150 mg/dL) can also signal liver dysfunction, malabsorption, or toxic burden. But as a standalone risk assessment tool, it fails because it cannot distinguish between metabolically healthy and metabolically dangerous lipid profiles.
Clinical Pearl
Cholesterol is a check engine light for the body. When there’s dysfunction or chronic illness, it frequently shows up in the lipid profile. Lowering the number without investigating the driver is like putting tape over the dashboard light. The clinical question is never “how do we lower this number?” — it’s “what’s driving this pattern?”
Don’t Forget: Cholesterol Is Essential
Cholesterol is required for cell membrane integrity, hormone production, vitamin D synthesis, and brain function — the brain contains 20% of the body’s total cholesterol and can synthesize its own. LDL particles also play a direct role in immune defense by binding to and neutralizing bacterial endotoxins, preventing inflammatory cascades that would otherwise be triggered by gram-negative bacteria.11
This is one reason why the relationship between cholesterol and mortality isn’t linear. Some miscarriages occur because of genetic defects where the baby’s body doesn’t make cholesterol — a condition incompatible with life. Without cholesterol, human life is not possible. The assessment must always account for context, particle characteristics, and upstream drivers — not a single composite number designed for a different era of medicine.
Tools like Blood Chem Studio organize the full lipid panel alongside metabolic, inflammatory, and thyroid markers — making discordance patterns and metabolic drivers visible within the broader clinical picture rather than reacting to a single number in isolation.
Go Deeper
Learn This Framework
Mastering the Art of Functional Blood Chemistry covers the complete cardiovascular assessment — advanced lipid markers, the insulin resistance dyslipidemia pattern, thyroid-cholesterol connections, and how to build focused intervention protocols using the Three-Tier Decision Tree.
Frequently Asked Questions
Is total cholesterol of 240 dangerous?
Not necessarily. A total cholesterol of 240 could reflect elevated HDL (protective), mildly elevated LDL with large buoyant particles (lower risk), or a problematic small dense LDL pattern driven by insulin resistance. The number alone cannot distinguish between these scenarios, which is why the full lipid panel with advanced markers and metabolic context matters more than the composite value.
What is the best cholesterol test to ask for?
A standard lipid panel is a reasonable starting point, but advanced lipid testing — including LDL particle number, ApoB, and small dense LDL — provides significantly better risk assessment. The TG/HDL ratio, which can be calculated from a standard panel, is also the single most valuable proxy for insulin resistance and metabolic health available without advanced testing.
Can total cholesterol be too low?
Yes. Research has linked total cholesterol below 160 mg/dL with increased non-cardiovascular mortality.1 Extremely low levels may also signal liver dysfunction, malabsorption, or toxic burden — the body uses cholesterol to detoxify, and in severe toxic exposure cases the body may not keep up with production. Cholesterol is essential for life, and the clinical question is always about context and pattern, not chasing the lowest number.
How does the TG/HDL ratio compare to total cholesterol for risk assessment?
The TG/HDL ratio is a significantly more useful calculated value because it reflects metabolic health and insulin resistance — the primary driver of atherogenic dyslipidemia. A ratio below 2.0 suggests healthy insulin sensitivity and a favorable particle profile. It can be calculated from any standard lipid panel, making it immediately actionable without advanced testing.
Does total cholesterol change with age?
Yes. Cholesterol levels naturally rise with age, and research suggests that higher levels in older adults may actually be protective. Functional optimal ranges shift upward after age 60, reflecting the evidence that the conventional “under 200” target may be inappropriately low for this population.
References
- Jacobs, D., Blackburn, H., Higgins, M., et al. (1992). Report of the Conference on Low Blood Cholesterol: Mortality Associations. Circulation, 86(3), 1046–1060.
- Ravnskov, U., Diamond, D. M., Hama, R., et al. (2016). Lack of an association or an inverse association between low-density-lipoprotein cholesterol and mortality in the elderly: a systematic review. BMJ Open, 6(6), e010401.
- Madsen, C. M., Varbo, A., & Nordestgaard, B. G. (2017). Extreme high high-density lipoprotein cholesterol is paradoxically associated with high mortality in men and women: two prospective cohort studies. Arteriosclerosis, Thrombosis, and Vascular Biology, 38(1), 2366–2374.
- Cromwell, W. C., Otvos, J. D., Keyes, M. J., et al. (2007). LDL particle number and risk of future cardiovascular disease in the Framingham Offspring Study. Journal of Clinical Lipidology, 1(6), 583–592.
- El Harchaoui, K., van der Steeg, W. A., Stroes, E. S., et al. (2007). Value of low-density lipoprotein particle number and size as predictors of coronary artery disease in apparently healthy men and women: the EPIC-Norfolk Prospective Population Study. Journal of the American College of Cardiology, 49(5), 547–553.
- De Oliveira-Gomes, D., Tsimikas, S., Ference, B. A., et al. (2024). Apolipoprotein B: Bridging the Gap Between Evidence and Clinical Practice. Circulation, 150(17), 1353–1366.
- Galimberti, F., Casula, M., Olmastroni, E., et al. (2023). Apolipoprotein B compared with low-density lipoprotein cholesterol and non-high-density lipoprotein cholesterol in predicting cardiovascular events: a systematic review. Pharmacological Research, 196, 106905.
- Garvey, W. T., Kwon, S., Zheng, D., et al. (2003). Effects of insulin resistance and type 2 diabetes on lipoprotein subclass particle size and concentration determined by nuclear magnetic resonance. Diabetes, 52(2), 453–462.
- Bowden, R. G., Wilson, R. L., & Beaujean, A. A. (2011). LDL particle size and number compared with LDL cholesterol and risk classification in Type 2 diabetes. North American Journal of Medical Sciences, 3(2), 92–98.
- Superko, H. R., & King, S., III. (2011). Lipid management to reduce cardiovascular risk: a new strategy is required. Journal of Clinical Lipidology, 5(5), 359–367.
- Flegel, W. A., Baumstark, M. W., Weinstock, C., Berg, A., & Northoff, H. (1993). Prevention of endotoxin-induced monokine release by human low- and high-density lipoproteins and by apolipoprotein A-I. Infection and Immunity, 61(12), 5140–5146.
Michael Rutherford • Wholistic Health Academy • wholistichealthacademy.org
